
It was a quieter week in financial markets. Issues around the banking sector have again faded into the background, but its too early to say that they are completely resolved. US debt ceiling negotiations are progressing. US President Biden hosted a White House meeting with House Speaker McCarthy and others. While there was no outcome from the meeting (although that was expected), talks between the policymakers are expected to keep going later this week which is positive. The next few weeks will see numerous headlines about this issue as politicians continue discussions and negotiations. Our detailed note about the US debt ceiling is available here.
US shares were down slightly (-0.3%) over the week, Australian shares were up by 0.5%, Eurozone equities were down 0.5%. Japanese stocks continued to track higher (+0.8%), back to its pre-Covid high and Chinese stocks were 2% lower over the week. Bond yields were mixed, as markets priced in some chance of a US Fed June rate hike late in the week. The US dollar was up and the $A was down slightly to 0.66 US dollars. Most commodity prices fell over the week and the oil price is down to $74/barrel.
Economic activity trackers
Our Economic Activity Trackers fell across Australia, Europe and the US due to lower hospitality bookings and a fall in job advertisements.
Based on weekly data for eg job ads, restaurant bookings, confidence, mobility, credit & debit card transactions, retail foot traffic, hotel bookings. Source: AMP
Our inflation indicator fell further this week and is indicating much further downside to inflation readings over coming months.
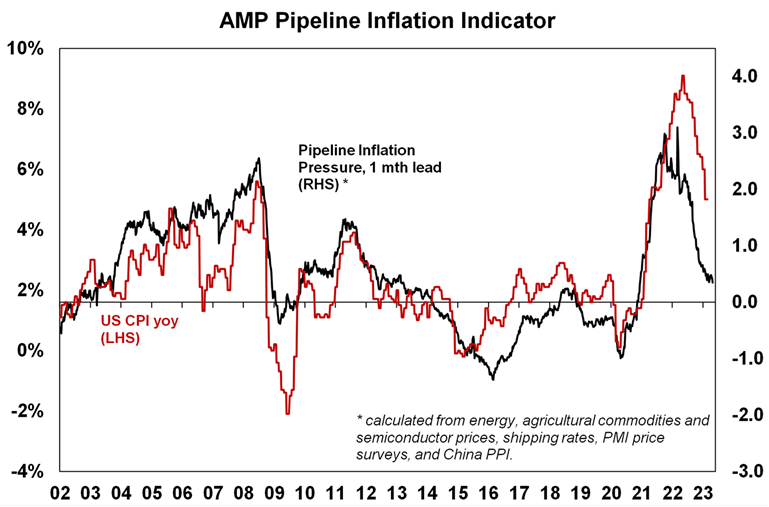
Source: Bloomberg, AMP
Major global economic events and implications
The US consumer price data for April was close to expectations. Headline prices were up by 0.4% (in line with expectations) with annual growth slowing slightly to 4.9%. Core inflation was also up by 0.4% (same as last month) and annual core inflation slowed to 5.5%. The components showed energy prices detracting from April CPI, food prices made a decent contribution, goods prices increased (with a big rise in used cars & trucks prices) while services inflation was slightly lower (see the chart below). US consumer price inflation is decelerating, but it is occurring a little slower than policymakers would prefer and still remains above the US Fed’s 2% inflation target. Nevertheless, inflation will continue slowing from here, given all the forward-looking inflation indicators are pointing down.
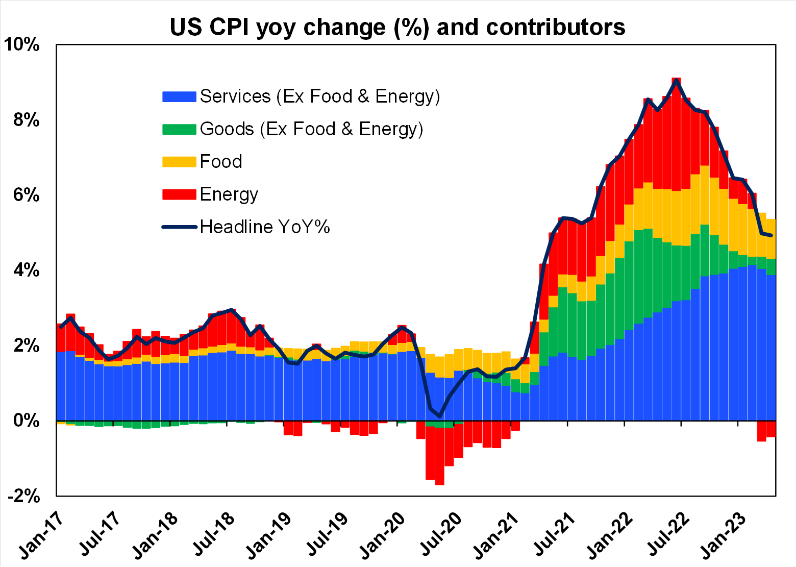
Source: Bloomberg, AMP
Shelter inflation rose by 0.4% in April, its lowest monthly increase since January 2022 and further downside is likely, given the weakness in new rents. Core services (excluding shelter), which the Fed is focussed on because of its high correlation to wages growth, remains elevated at 5.9% (see the chart below).
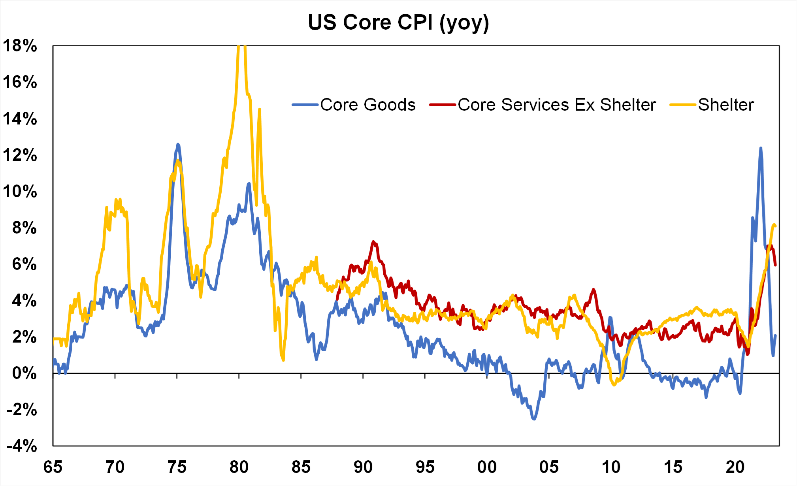
Source: Bloomberg, AMP
US producer prices are in a firm downswing, with prices up by only 0.2% over the month or 2.3% over the year, well down from its high of 11.7% in early 2022 which should filter through into consumer prices in coming months.
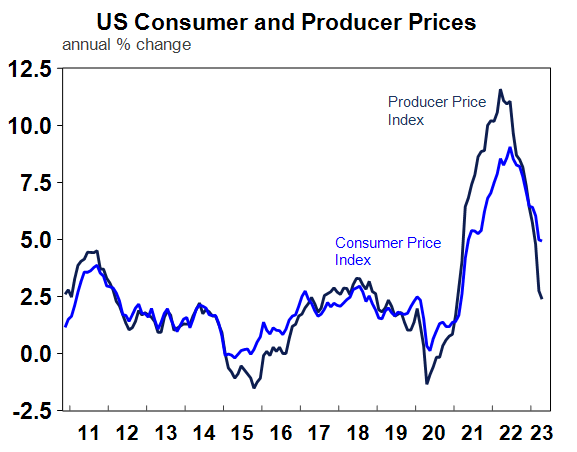
Source: Macrobond, AMP
The US University of Michigan consumer sentiment survey showed a deterioration in confidence but more importantly , consumer inflation expectations for the next 5-7 years lifted to 3.2%, its highest level in 12 years (see the chart below). This seems at odds with all of the inflation indicators which indicate lower inflation through 2023 which could see this preliminary readings from the University of Michigan revised down.
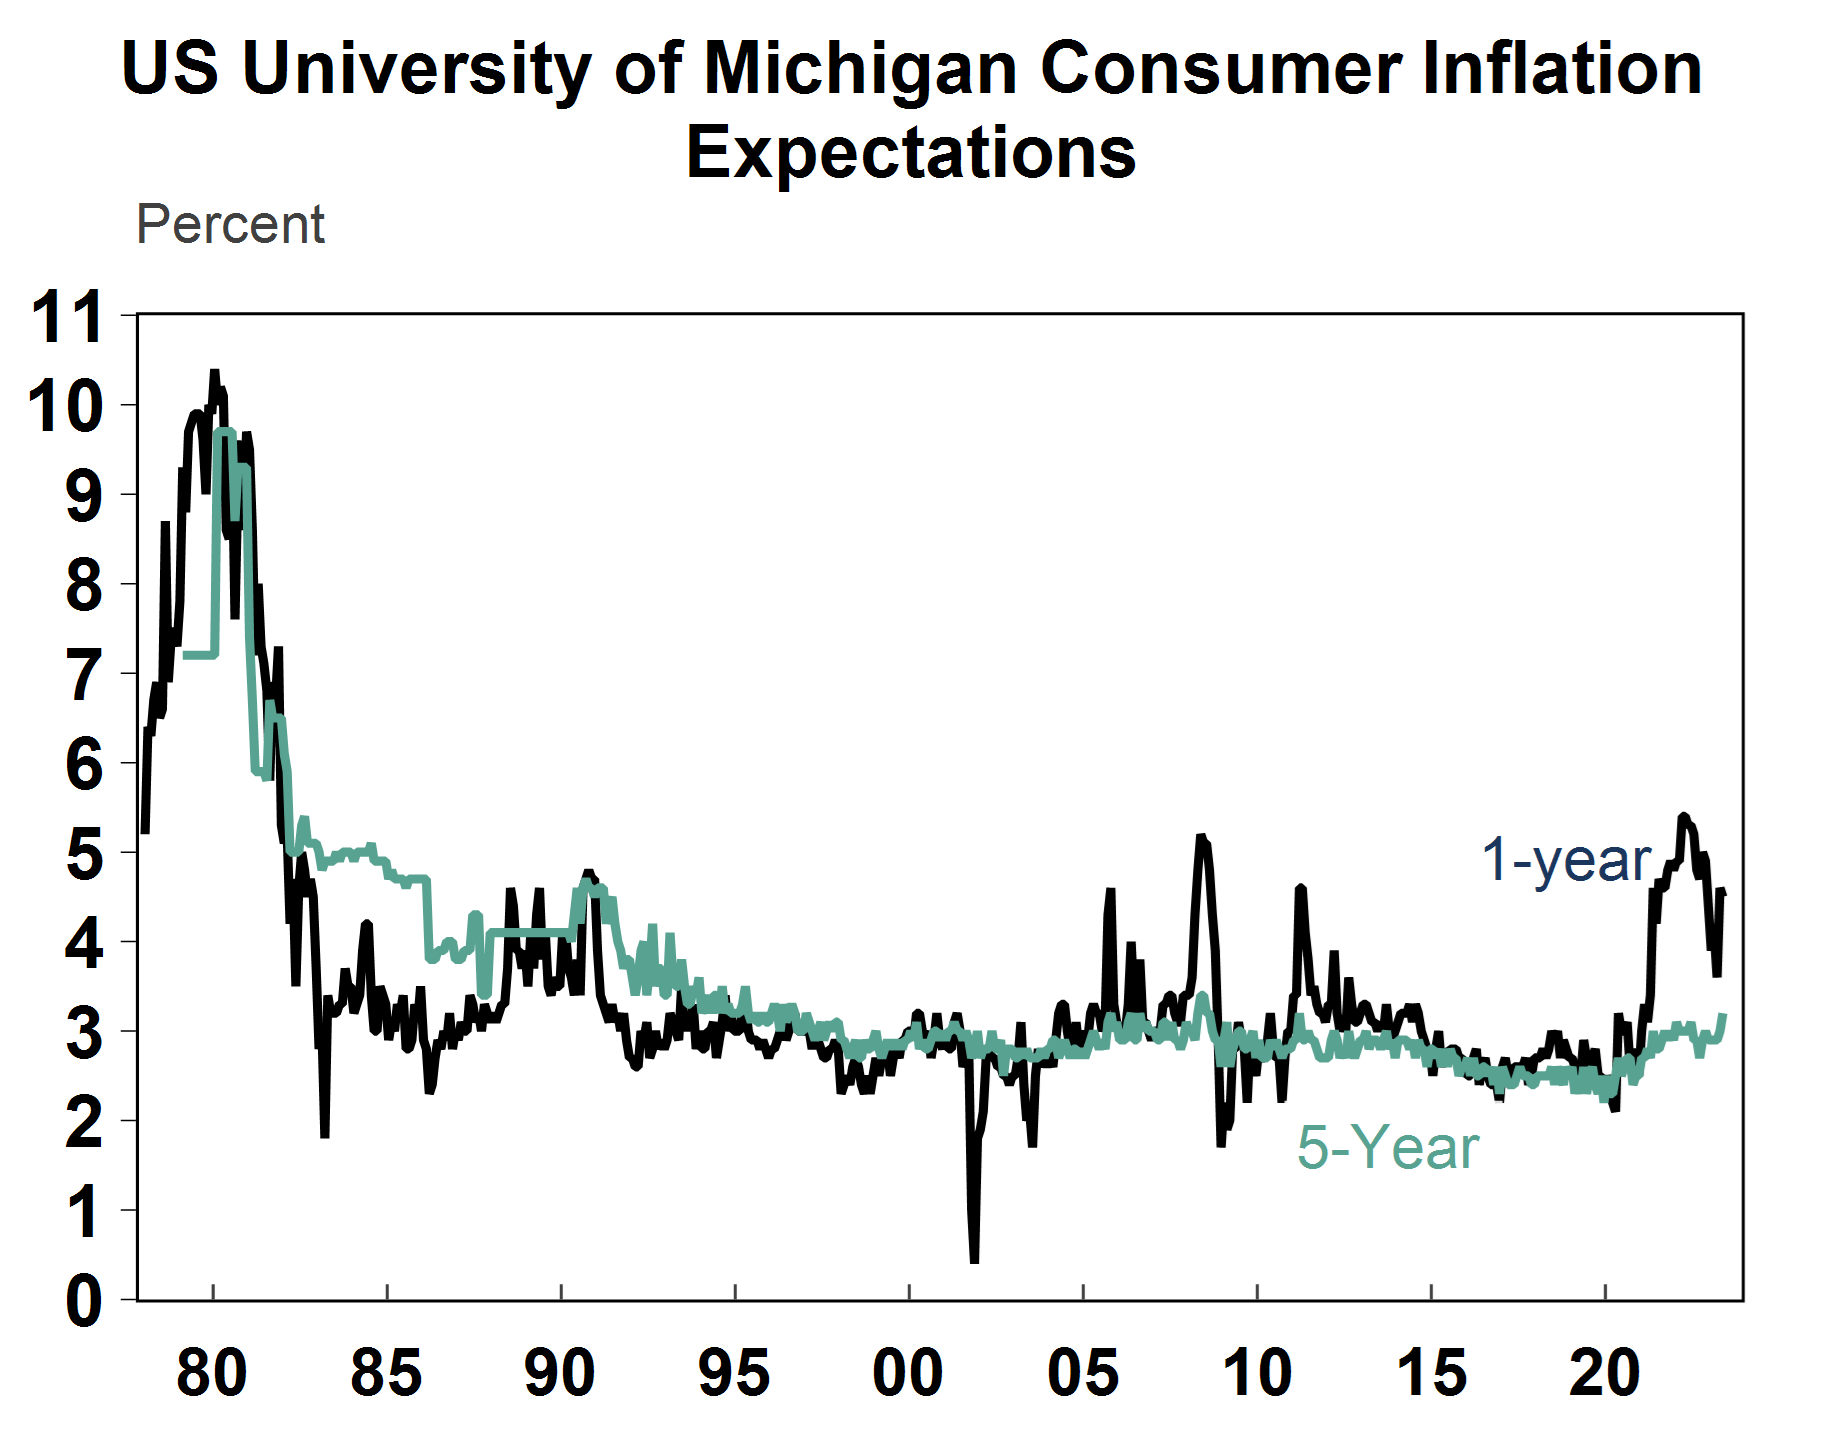
Source: Macrobond, AMP
Financial markets are now pricing in around a 12% chance of a June rate hike and ~4 interest rate cuts from the Fed by January next year, which seems a little too aggressive (we think there will be 1-2 cuts over this period because the Fed will probably be conscious of adding to inflation again by cutting rates). This chart from Deutsche Bank shows that on average there are around 4 months from the last Fed hike to the first cut. If the last hike will prove to have been in May, then this would take us to September and the market is pricing the first cut by November. So, expectations for the start of the Fed cutting cycle looks fair, based on history.
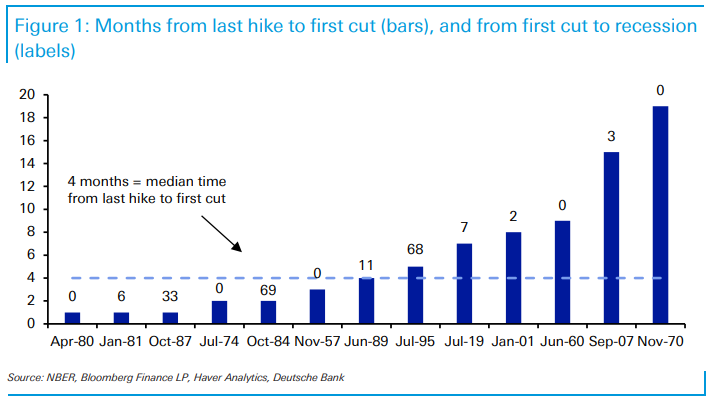
Source: Deutsche Bank, AMP
The US April Senior Loan Officers survey showed some further deterioration in lending standards, especially for commercial real estate and commercial and industrial loans (see the chart below) compared to January with lending standards the tightest since the GFC (apart from the pandemic). But given the banking sector issues which exploded in March the good news is that there is no sign of a major credit crunch (yet!). However, lower demand for loans and a further tightening of lending standards is likely going ahead which will weigh on economic growth.
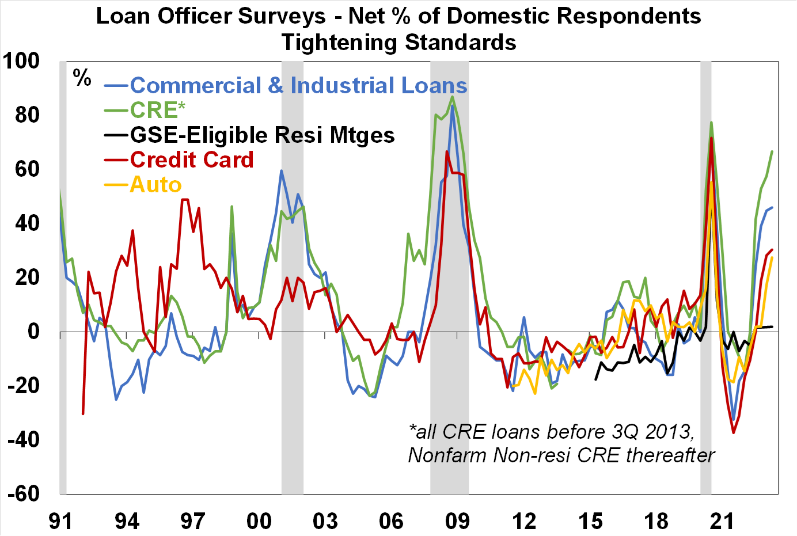
Source: US Federal Reserve, AMP
More signs of a deterioration in the US labour market, with initial jobless claims up in the first week of May to be above the pre-covid average (see the chart below) which indicates slowing employment growth and a rise in the unemployment rate from here.
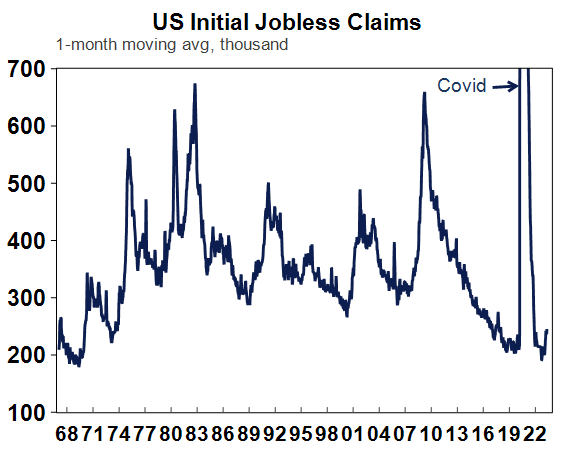
Source: Macrobond, AMP
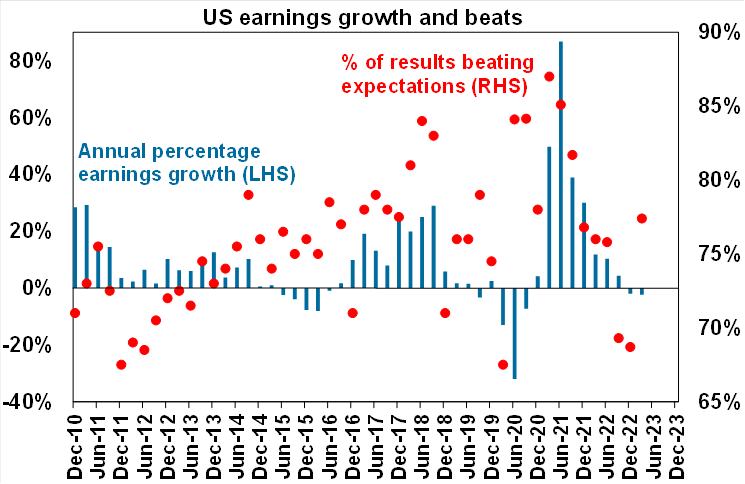
91% of US S&P500 companies have reported first quarter earnings and 77% have delivered a positive earnings surprise, which is slightly above the long-run average and better than the December quarter earnings season which shows some recovery in earnings. Annual earnings growth are expected to be around -2.4% year on year for the March quarter but are likely to decline in coming periods as growth and inflation slows. However, earnings are still holding up well given recession fears.
Source: Bloomberg, AMP
The UK’s Bank of England met this week and hiked interest rates by 0.25%, as expected, taking interest rates to 4.5%. The risk is with another rate hike over coming months, but 2 members of the Monetary Policy Committee voted against a hike (7 voted for a hike) so it’s not a done deal.
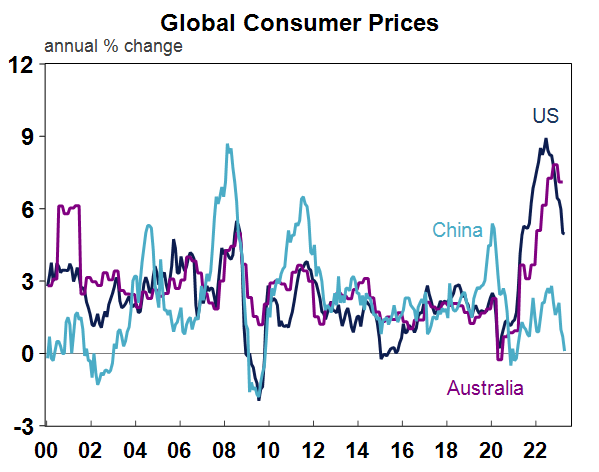
In China, the consumer price inflation data was soft, up by only 0.1% over the year to April while producer prices are in deflation, down by 3.6% over the year. China does not have an inflation problem (see the chart below) like the major advanced economies.
Source: Macrobond, AMP
Australian economic events and implications
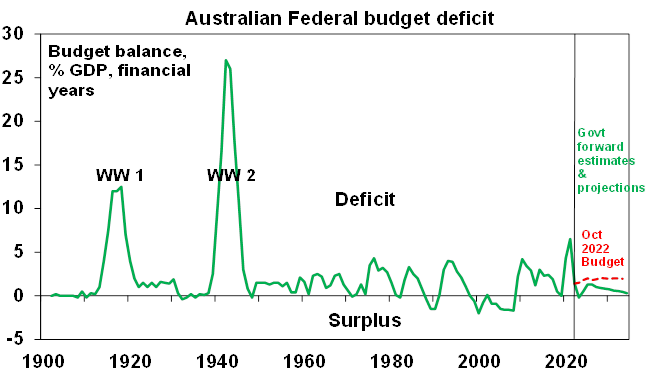
A very busy week in Australia with the release of the 2023-24 Federal Budget (our detailed note is here). The main takeaways is that the budget has moved into a surplus in 2022/23 of $4.2bn or 0.2% of GDP which is the first surplus in 15 years and the fastest improvement in the deficit as a share of GDP since the end of WW2. This is thanks to huge revenue flows from a combination of higher personal tax collections due to stronger jobs and wages growth, higher commodity prices and higher non-mining profits than Treasury had forecast. This was just a matter of good luck flowing to Canberra and is unlikely to be repeated to the same extent in the out-years (given downside growth risks) which is why budget deficits (albeit smaller deficits) are still predicted in the out-years. The government expects to spend some of this extra revenue through additional stimulus, but most of it (86% out to 2026-27) has been saved. In 2023-24 there will be $12bn of new stimulus or 0.5% of GDP which is getting some economists anxious about adding to inflation through lifting consumer incomes. However, the government is still expecting to take out more from the economy ($42bn) than its adding to policy, so we do not think that the new policy announcements will be particularly stimulatory and add to higher consumer spending, therefore the impacts for the RBA are minimal. The government’s cost of living measures will actually directly help lower measured inflation (we think by around 0.4 percentage points through 2023-24) which could help to lower inflation expectations.
Source: Australian Treasury, AMP
Market pricing for the RBA has not changed significantly after the budget, with about an 15% change of a hike in the next few months and one rate cut priced in by the end of the year.
Some internal RBA documents released this week as part of the “Freedom Of Information” laws showed that the RBA’s modelling indicates that recession odds in Australia could be as high as 65-80% by September 2024 but this is in line with US recession risks and the signal from the yield curve so we don’t think that this reveals anything new. Another document also showed RBA analysis about the impacts of the cash rate rising to various levels. Surprisingly, the RBA’s modelling suggests that with a cash rate at 4.8% would not trigger an economic downturn and would only push the unemployment rate to 4.5% (from its current level of 3.5%) which is our current forecast with the cash rate at 3.85%! This could be a hawkish sign for the RBA but we think that upcoming economic data will disappoint expectations, as impacts of rate hikes start to bite and as inflation slows faster than forecast which will keep the RBA on hold from here.
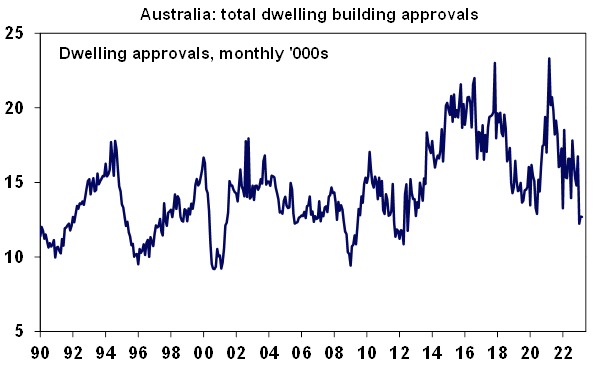
March building approvals fell by 0.1% in March but are 17.3% down on a year ago and are tracking around an 11-year low which will keep downward pressure on residential investment, weighing on GDP growth.
Source: ABS, AMP
March quarter retail volumes fell by 0.6% after declining by 0.3% last quarter (a retail recession!?), as nominal spending was flat but retail prices rose by 0.6%. Retail volume has clearly slowed as consumers feel the impacts from interest rate hikes.
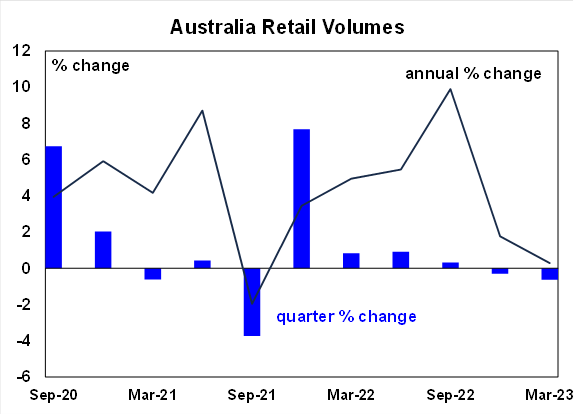
Source: ABS, AMP
The NAB business survey showed that business confidence was flat in April, after being slightly negative in March. Business conditions are still positive but are moderating. Business confidence has been trending down, in line with consumers (see the chart below) and has further room to fall.
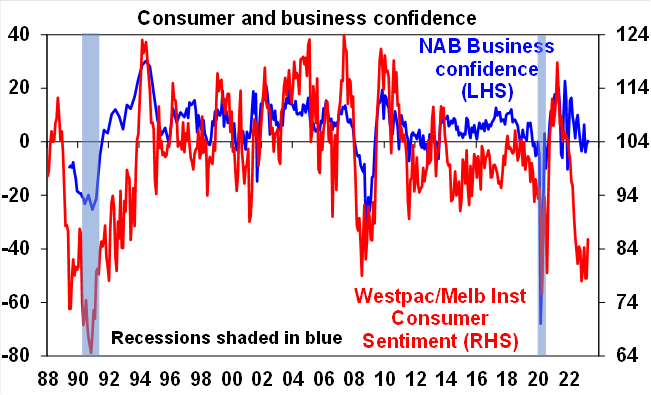
Source: Melbourne Institute, NAB, AMP
What to watch over the next week?
In Australia, the RBA May meeting minutes are unlikely to reveal anything new, given the commentary in last week’s Statement on Monetary Policy and Governor Lowe’s speech at the Board dinner. The minutes should show that the decision to raise the cash rate in May was a close call. The March quarter wage price index should show annual wages growth running at 3.6% over the year – up from its pre-pandemic low of just over 2% but not consistent with a wage-price spiral. April employment figures are expected to show a slower pace of jobs growth, up by around 20K which should keep the unemployment rate unchanged at 3.5%. The Melbourne Institute consumer sentiment index for May is also released which is likely to show a fall in confidence after the RBA’s unexpected hike.
Next week in the US watch for NY Fed’s manufacturing index, April retail sales (expected to be up modestly), April industrial production (expected to be flat), May NAHB housing market index, April building permits, the Philadelphia Fed manufacturing index for May, April existing home sales and leading indicators for April which are expected to remain in recession territory. Fed Chair Powell also speaks. The start of the Q2 data will give a good guide to the pace of growth in the US and is likely to confirm that the US economy is not in recession for now (despite the poor readings from leading indicators and the yield curve!).
In Europe there is March industrial production data, March quarter GDP data which is expected to show low growth but not in line with a recession and March quarter employment figures.
Chinese activity data should show that April industrial production data was up by 4.9% year to date, retail sales growth was likely strong in April and up by 8.2% year to date, fixed asset investment is expected to be 5.7% higher year to date and the jobless rate is expected to be virtually unchanged in April at just over 5%.
Japanese March quarter GDP is expected to up by a modest 0.2% over the quarter or 0.8% on an annualised basis. April CPI data is expected to show headline inflation running around 3%yoy.
CPI data is also released in Canada and should show further moderation in April in prices, with annual inflation running at around 4%. Retail sales figures are expected to be negative in March as the impacts of rate hikes continue to hurt households.
Outlook for investment markets
The next 12 months are likely to see easing inflation pressures, central banks moving to get off the brakes and economic growth weakening but stronger than feared. This along with improved valuations should make for reasonable share market returns this year in contrast to 2022. But the next few months may be rough given high recession and earnings risks, uncertainty around US banks and raising its debt ceiling, geopolitical risks and poor seasonality out to around September/October. This is likely to impact both global and Australian shares.
Bonds are likely to provide returns above running yields, as growth and inflation slow and central banks become less hawkish.
Unlisted commercial property and infrastructure are expected to see slower returns, reflecting the lagged impact of last year’s rise in bond yields on valuations. Commercial property returns are likely to be negative as “work from home” hits space demand as leases expire.
With an increasing supply shortfall, we have revised up our national average home price forecast for this year from a fall of -7% to around flat to up slightly ahead of 5% growth next year. However, the risk a further leg down putting us back on track for a 15-20% top to bottom fall on the back of the impact of high interest rates and higher unemployment are very high (at around 45%) with the latest RBA hike adding to that risk.
Cash and bank deposits are expected to provide returns of around 3.5%, reflecting the back up in interest rates.
A rising trend in the $A is likely over the next 12 months, reflecting a downtrend in the overvalued $US and the Fed moving to cut rates.
What you need to know
While every care has been taken in the preparation of this article, neither National Mutual Funds Management Ltd (ABN 32 006 787 720, AFSL 234652) (NMFM), AMP Limited ABN 49 079 354 519 nor any other member of the AMP Group (AMP) makes any representations or warranties as to the accuracy or completeness of any statement in it including, without limitation, any forecasts. Past performance is not a reliable indicator of future performance. This document has been prepared for the purpose of providing general information, without taking account of any particular investor’s objectives, financial situation or needs. An investor should, before making any investment decisions, consider the appropriateness of the information in this document, and seek professional advice, having regard to the investor’s objectives, financial situation and needs. This article is solely for the use of the party to whom it is provided and must not be provided to any other person or entity without the express written consent AMP. This article is not intended for distribution or use in any jurisdiction where it would be contrary to applicable laws, regulations or directives and does not constitute a recommendation, offer, solicitation or invitation to invest.
The information on this page was current on the date the page was published. For up-to-date information, we refer you to the relevant product disclosure statement, target market determination and product updates available at amp.com.au.