

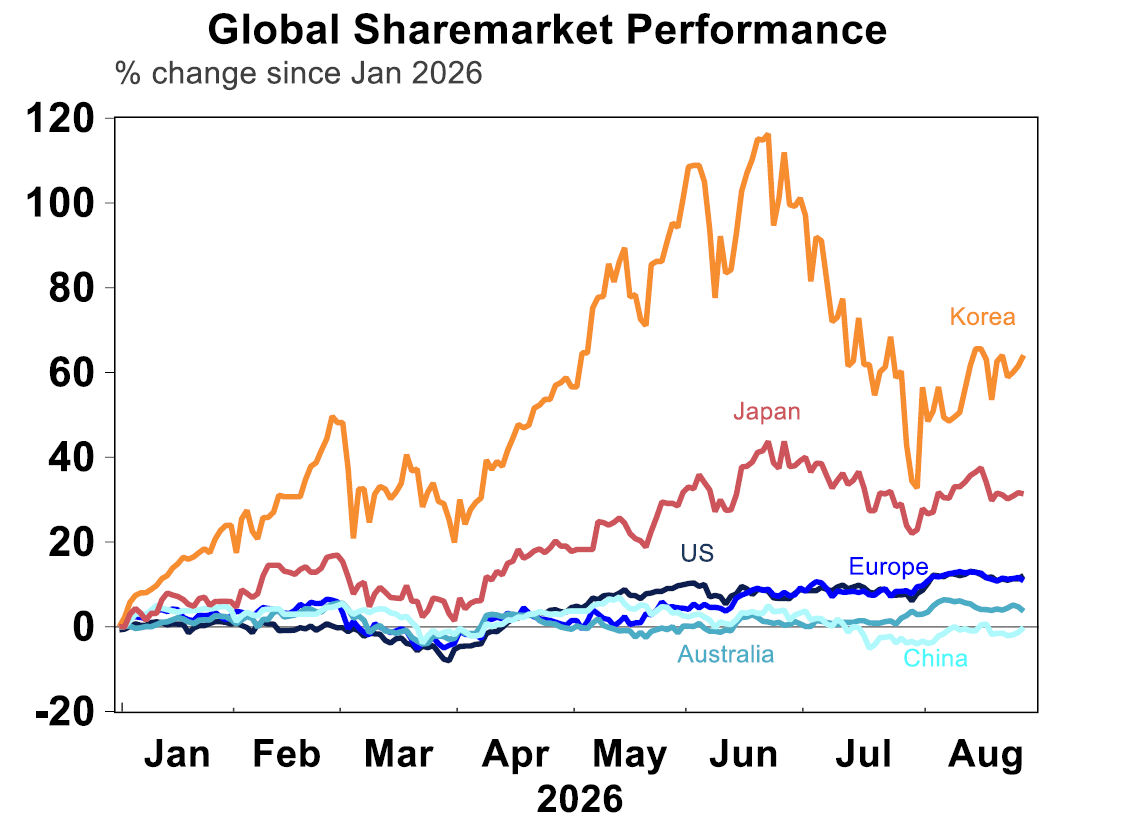
Sharemarkets generally pushed higher this week on further signs of a progress in oil shipments through the Strait of Hormuz, more blockbuster US tech earnings, continued solid US economic data, relatively unchanged bond yields and signs that US inflation pressures are not reaccelerating. This is despite a more hawkish sounding US Fed, a new economic phase of the US/Iran war and a re-escalation in trade tensions between the US and Canada. US shares were 0.5% higher with a big rise in tech, communication and financial stocks while energy, health care and industrials were down. Japanese shares rose but Korean shares (which is mostly tech-related semiconductors) fell, after being a bit outperformer earlier this year. Australian shares were up 0.4% but have lagged global share performance. Domestic profit growth can’t compete with blockbuster US outcomes and there were more signs this week that another RBA rate hike may come sooner than expected.
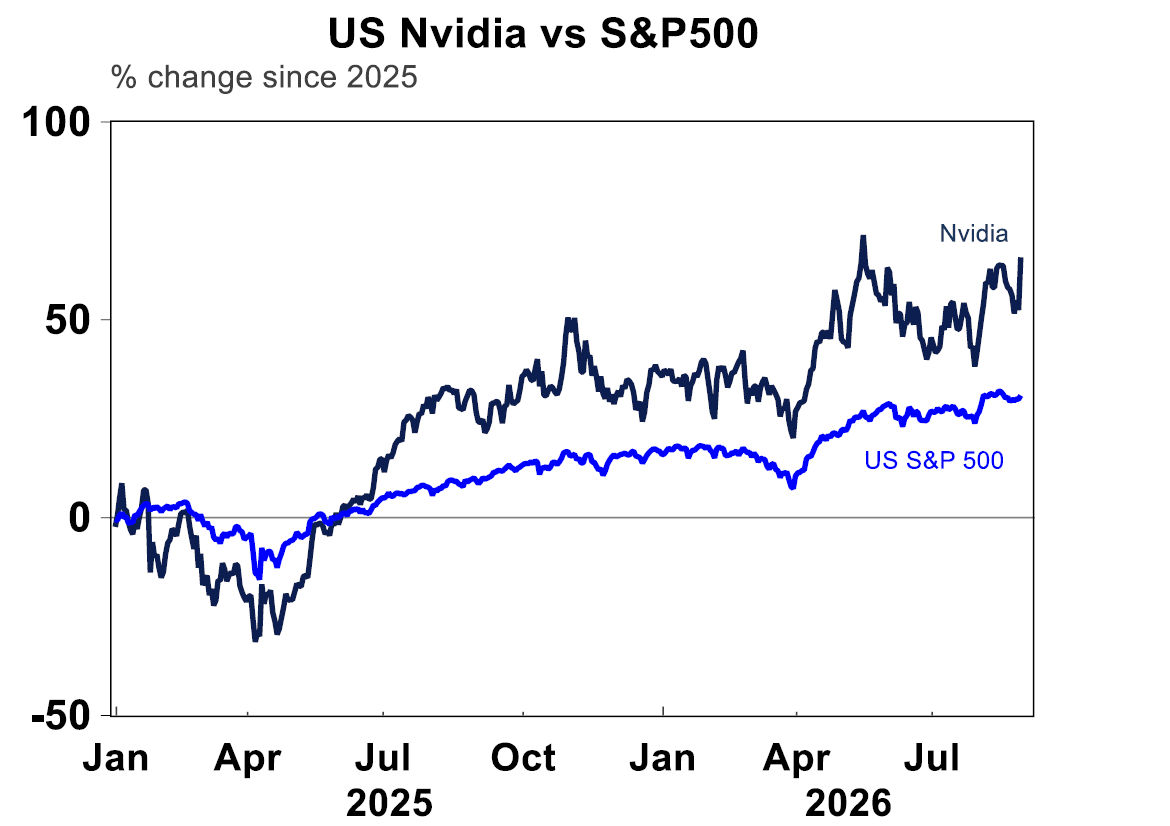
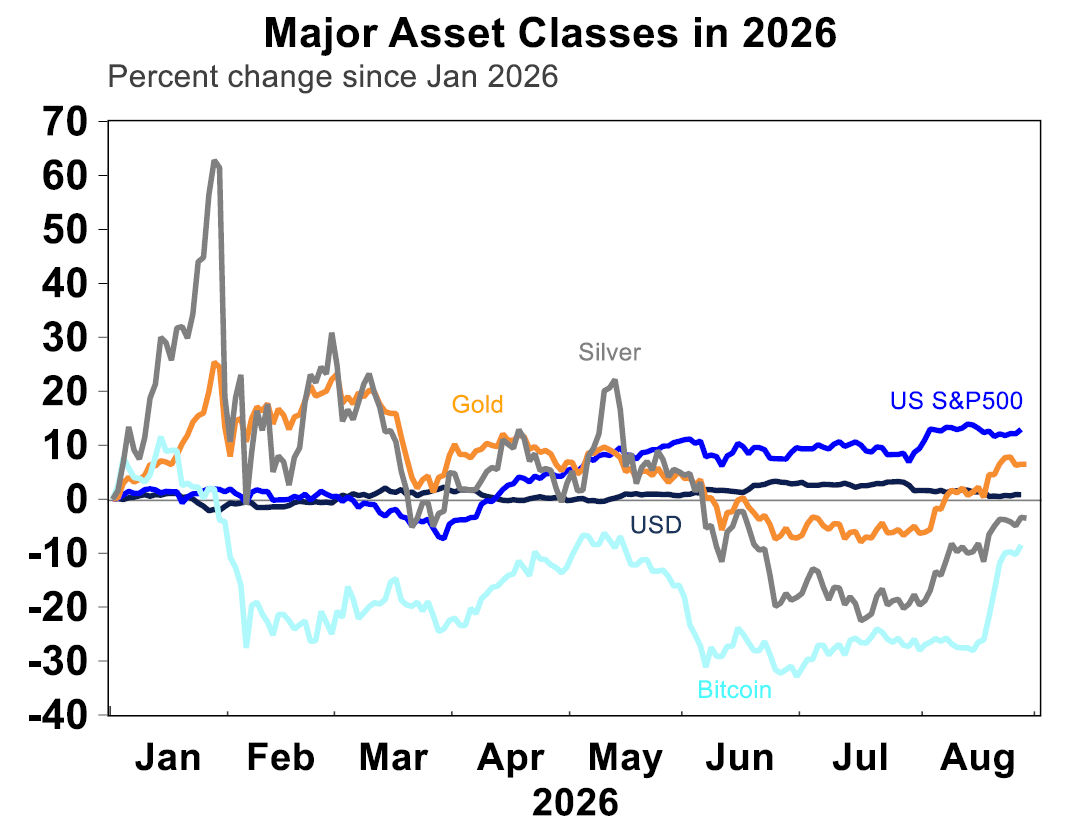
The world’s largest chipmaker, Nvidia reported strong earnings this week – sales growth up 106%, earnings increased 110% and revenue is expected to be up by 70% in the 2027 calendar year. Better outlook for software firms helped stocks like Salesforce and CrowdStrike. Nvidia remains an outperformer – see the chart below and outlook (given the earnings outcome) seem like the outperformance against the broad index will continue.
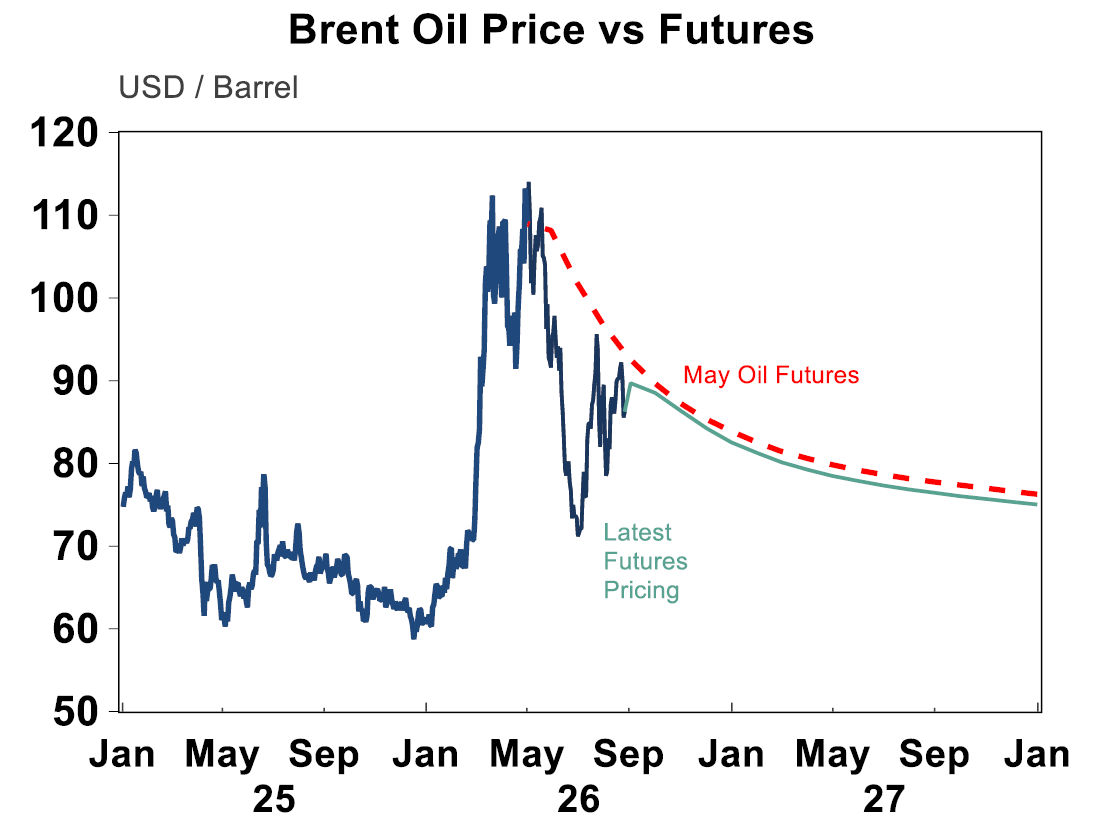
Oil prices declined this week and are just under $90/barrel, still above the ~$60 pre-Middle East conflict but well above their recent highs. Some positive news this week was a sign of some agreement between Iran and Oman to a “revenue sharing agreement” on the Strait of Hormuz. But there was little detail and we don’t have any specifics about what the fees would be. But it’s a step in the right direction, which is how markets took it. The “futures” oil market which basically predicts where prices will trade suggests prices will average out just under $80/barrel into 2027.
It’s hard to see oil prices falling to $60/barrel anytime soon, with the US/Iran war now shifting from military strikes into a new economic phase. US Treasury Secretary Scott Bessent announced “Operation Economic Outcast” (a fancy title for something which is just more Iranian sanctions) with the purpose to increase economic pressure on Iran and bring them back to the negotiating table. The new measures are expanded secondary sanctions (basically for non-US companies and banks) across five areas (digital assets, technology, gold, aviation and shipping) and more consequences for foreign entities that do business with Iran. Given that major Iran institutions are already subject to extensive US sanctions, it’s hard to see how this will significantly move the needle. It depends on how much effort goes into enforcing them. The largest impact of these sanctions is probably on China, who is a big buyer of Iranian crude oil but it’s hard to know how these sanctions are actually going to be imposed. The China-US trade relationship is already on eggshells and it’s hard to see Trump triggering a major escalation before the Trump-Xi meeting in the US in September.
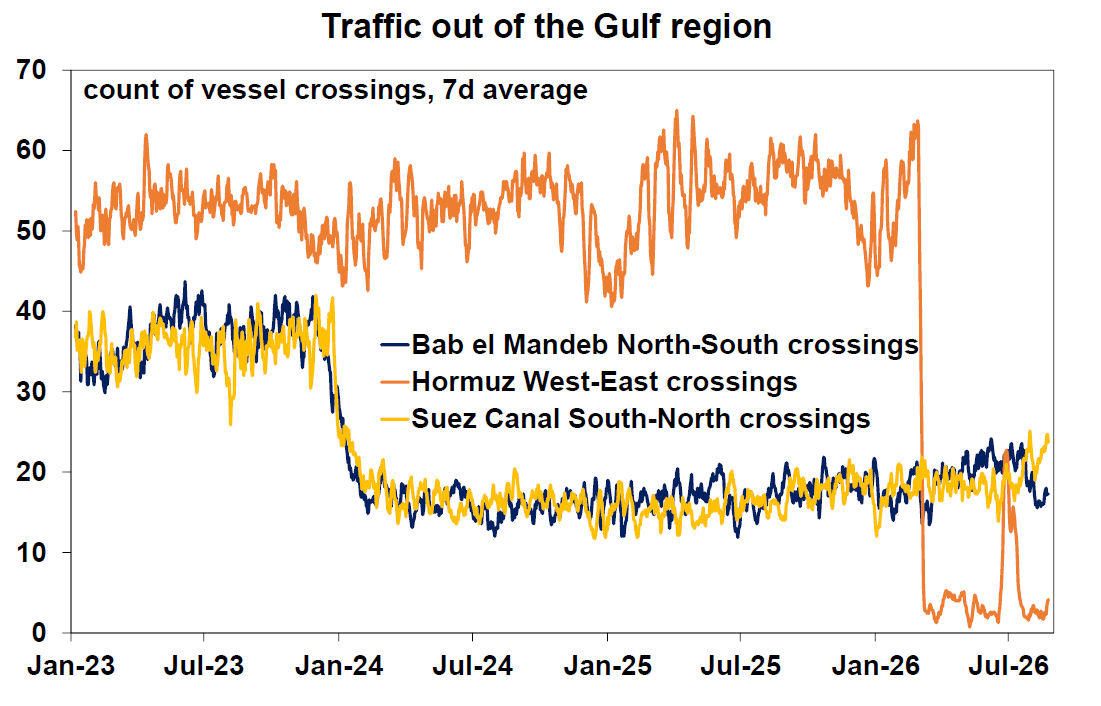
Shipping activity through the Strait of Hormuz remains very subdued and is well below the spike in traffic that occurred when the Memorandum of Understanding was initially signed. Although, some reports suggest that unofficial ships passing have skyrocketed but ships are turning off their transponders to avoid detection. This may have some merit as the oil price remains lower than you would have expected given the hit to vessel crossings.
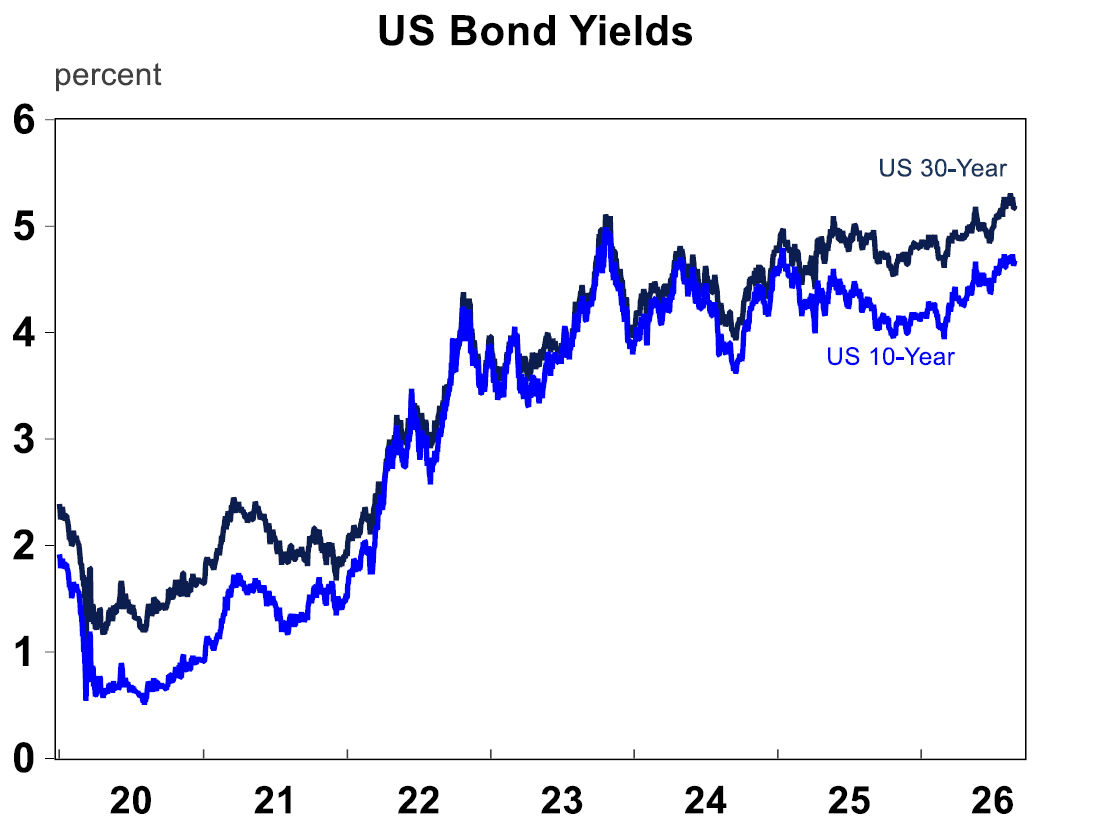
Treasury’s efforts to cap rising bond yields are working (so far anyways). US 10-year bond yields are just under 4.7% and moved a tad lower after last week’s US Treasury Secretary announcement about the government’s intention to increase buybacks of long-term bonds in an effort to reduce bond yields. We write in detail about this issue here.
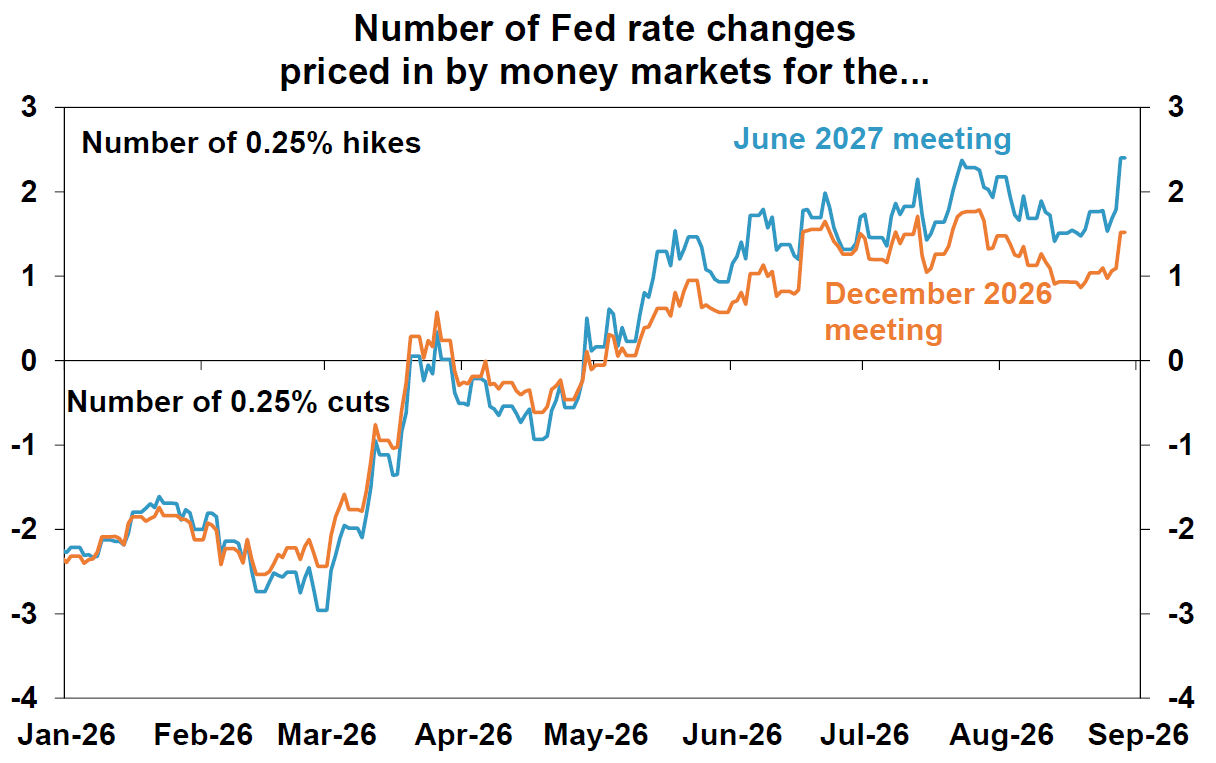
Fed Chair Warsh delivered his first speech at the annual Jackson Hole Economic Policy symposium – a gathering of the world’s most influential central bankers, economists and academics. His speech was anticipated because his recent press conferences after the Fed meetings have been unusually vague, giving financial markets a perception that the Fed is not super-focussed on meeting its 2% inflation goal. But this time round, Warsh gave a sharper and clearer message, signalling a more hawkish approach to interest rates – the FOMC (the committee that sets interest rates) “must be confident that underlying inflation is moving to our objective, clearly and at sufficient speed”. According to Warsh the summer data “do not tell me that underlying trends have meaningfully improved”. This sentiment has now led to financial markets pricing in a nearly 60% chance of a rate hike in September and with 1.5 rate hikes before the end of the year and over 2 hikes by mid-2027 – see the chart below. Bond yields moved a little higher as a result and so did the US dollar. The stronger $US has also now pushed the Yen to its weakest level in a month, erasing some of the gains after the US-Japanese intervention. It probably means the likelihood of more intervention from authorities.
The end of the crypto winter? This move from Treasury could give fire to the “debasement trade” – a fall in the US dollar versus rises in assets with finite supply like Gold and Bitcoin (i.e. alternative to fiat money). Bitcoin had a good rally this week and is back up over $80K, having rallied nearly 30% in recent weeks – maybe the Bitcoin winter is over!
US/Canada trade tensions escalate. The US-Canada trade talks broke down at the eleventh hour last weekend. As a result, the US imposed a 50% tariff on US$20bn of Canadian exports, equivalent to roughly 5% of Canada’s goods exports. The tariffs were implemented using Section 338 of the Tariff Act of 1930 and sit outside the USMCA free trade agreement framework, under which most US-Canada trade continues to occur.
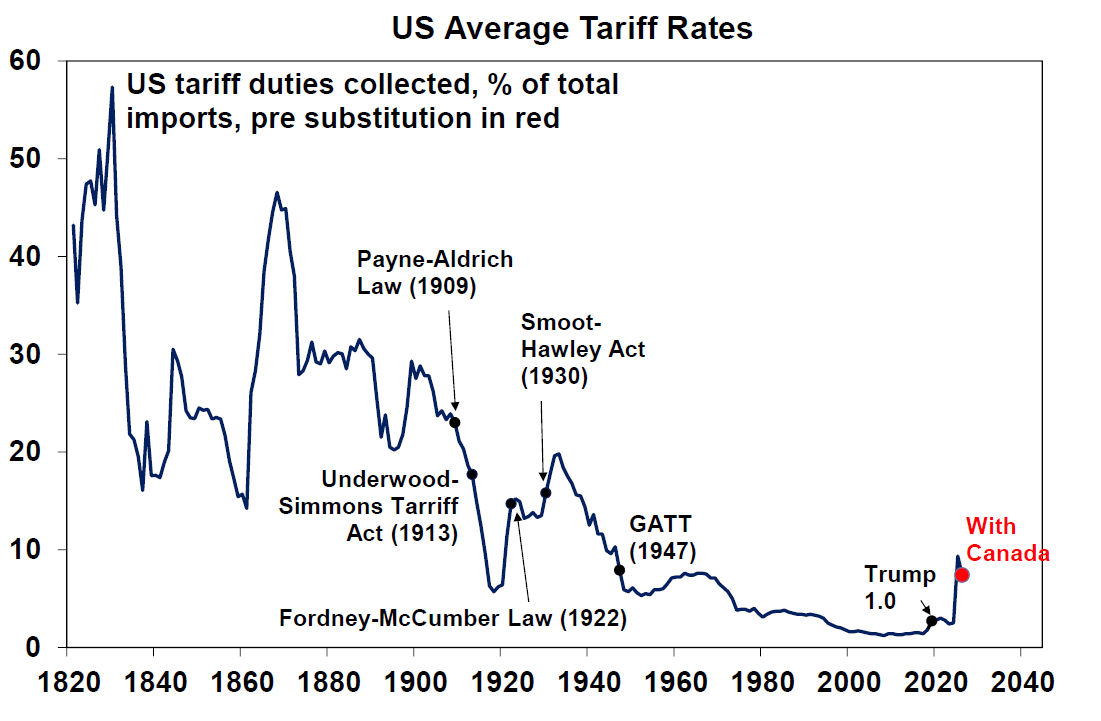
The impact of all of this is an increase in the US tariff rate on Canadian goods from 2.85% to over 5% (see the chart below). This tariff rate is still much lower than other countries.
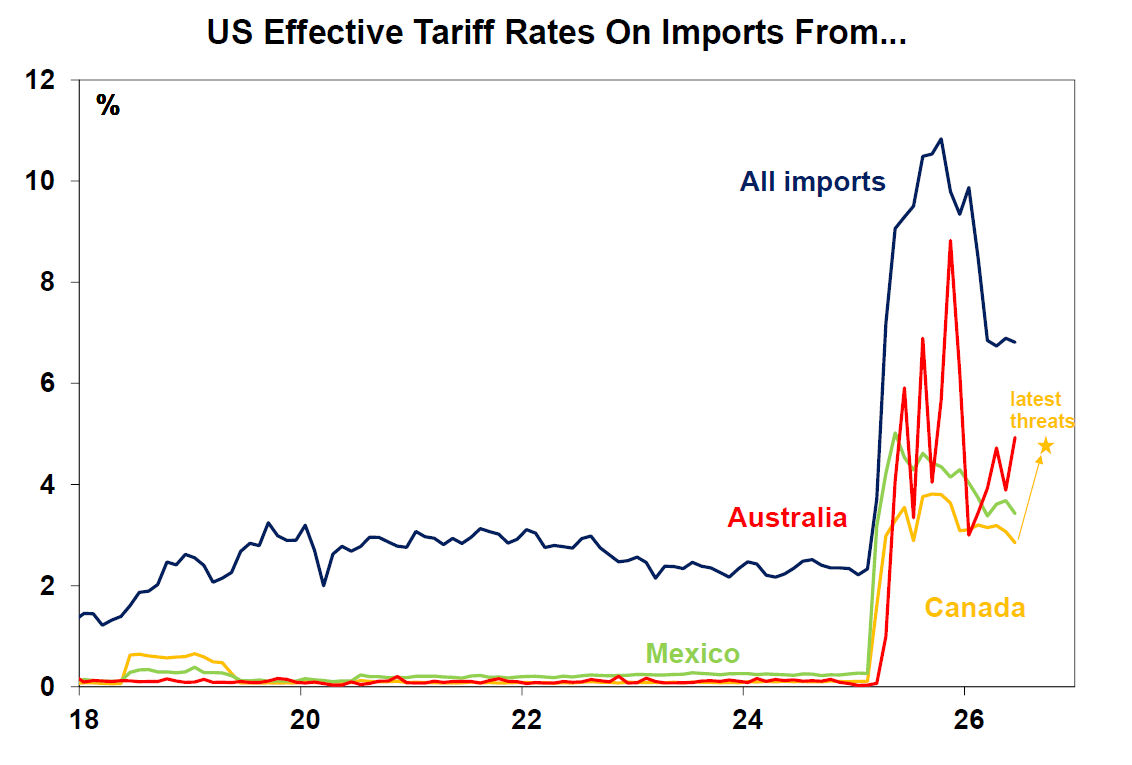
But it’s not great news for Canada, which helps explain why Prime Minister Carney quickly announced additional support for affected workers and businesses. Canada has also responded that it will match the tariffs “dollar for dollar” with these taking effect from 8 September in sectors such as steel, dairy, appliances, agricultural equipment, pulp and paper and electronics. The immediate impact of higher US and Canadian tariffs is more inflation in both the US and Canada for the impacted goods.
At the same time, it’s worthwhile keeping mind that over 80% of goods that flow between US-Canada-Mexico are under the USMCA free trade agreement and continues to face zero tariffs. In addition, some measures do not come into effect under later dates (like autos from 2027), and exemptions and concessions are likely to emerge once negotiations resume the initial bravado wears off. This is the ongoing theme of the Trump administration – start off hard and tough and moderate the stance later on. The US average tariff rate we estimate is around 6.8% now and will increase to 7.4% with the latest tariffs on Canada. But it might not even get this high if we get some tariff concessions. And this tariff rate is still way below Trump’s post “Liberation Day” threatened highs of ~35%.
Major global economic events and implications
US economic data continues to point to resilience.
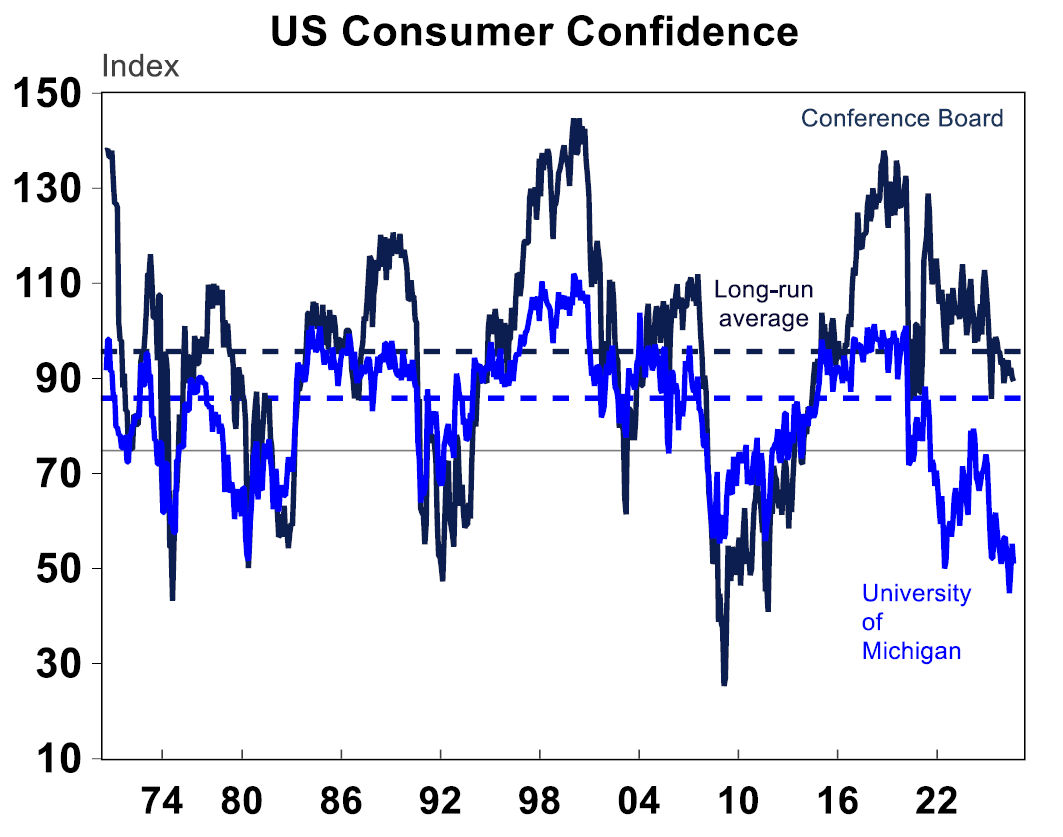
The US Conference Board consumer confidence data showed a slight fall for August, but still in-line with its long-run average, which shows that households are still optimistic about economic conditions despite higher interest rates and ongoing trade uncertainty – it’s a good sign for consumer spending.
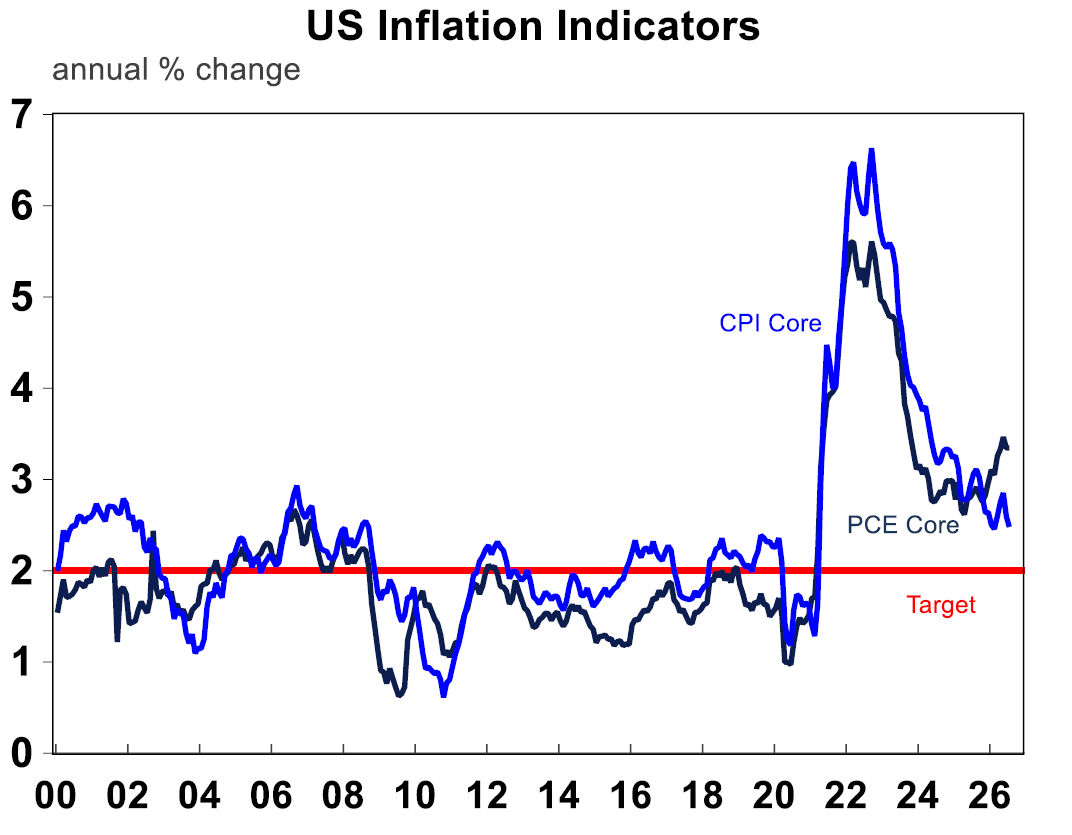
The US personal consumption expenditure deflator (which is another measure of inflation) should annual growth of 3.7% and core at 3.3% – both unchanged from last month and mostly as expected. Inflation is of course well above the target of 2% but there was little in the data that suggests a material reacceleration in inflation from here – so it’s not really moving the monetary policy dial for now.
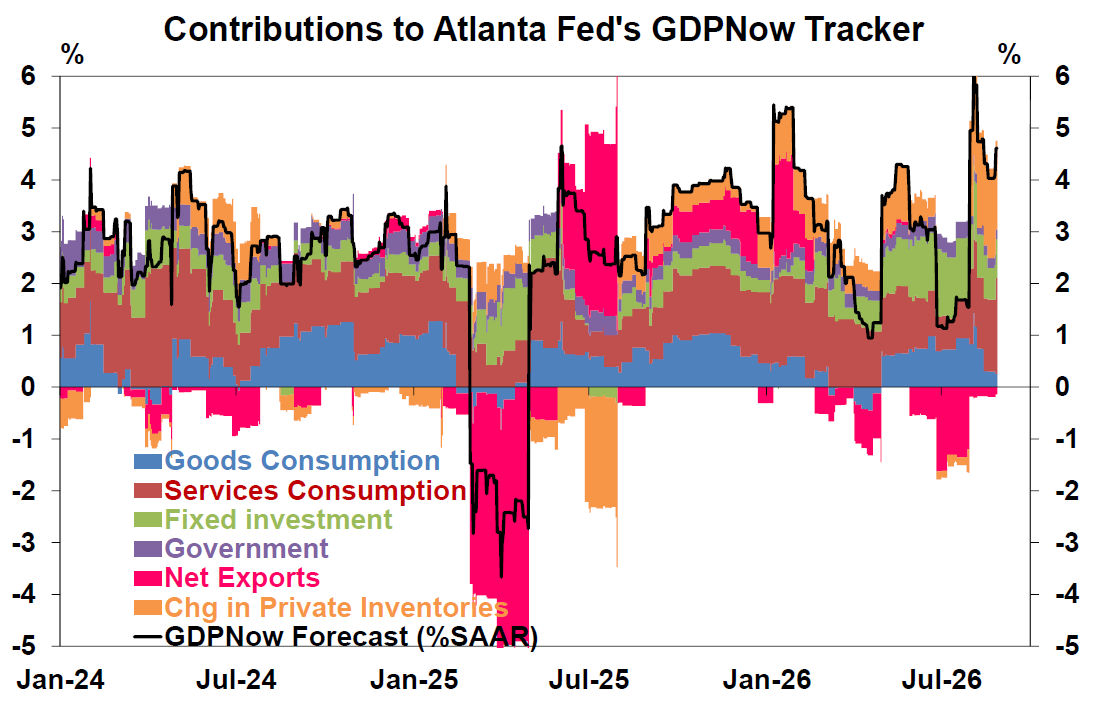
Other bits and pieces of monthly data like income and spending data, durable good and inventories all feed into the usual GDP puzzle. The third quarter GDP Atlanta Fed “GDPNow” indicator takes all of these updates and is indicating that third quarter GDP is running at ~4.6% (annualised). GDPNow tends to over and undershoot the eventual outcome, so actual growth is likely to be lower but nevertheless it shows continued resilience in the US.
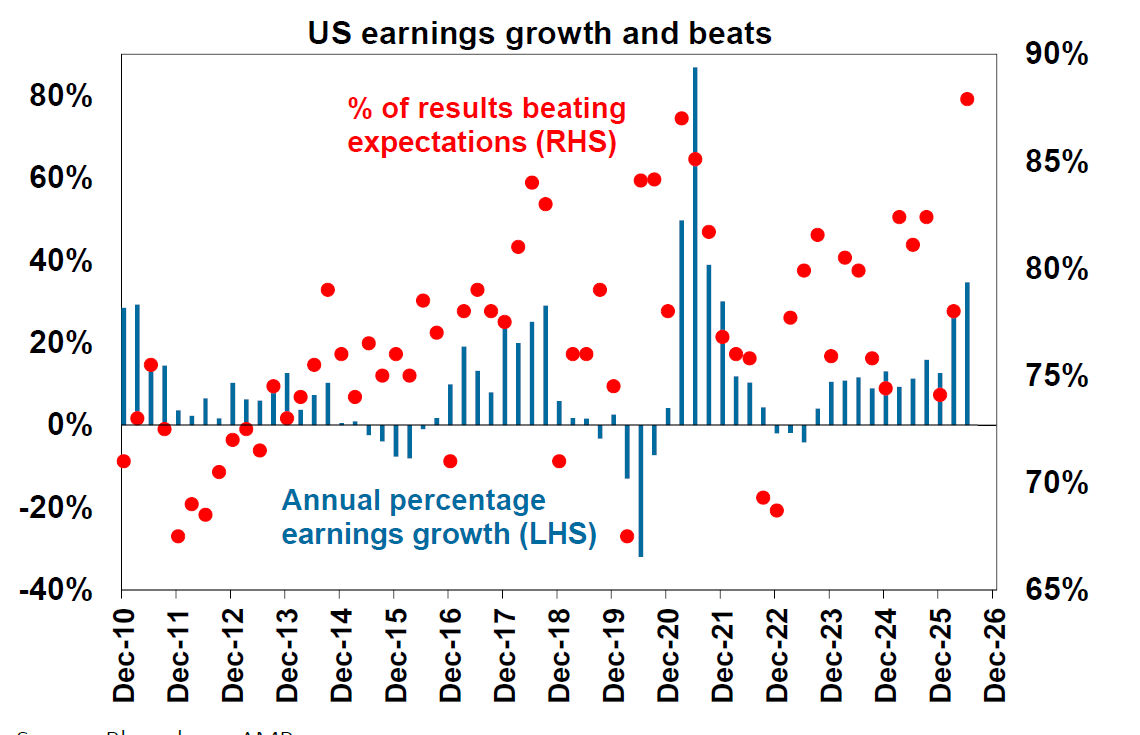
It’s the tail end of June quarter US earnings, with most companies now having reported. It’s been a really strong quarter with nearly 88% of results beating expectations –the highest beat we have on record). The surprise has been in the upward revisions in June quarter earnings, which are now up 35% over the year to June (tech ~53%, financials 21%, non-cyclicals 12% and energy 143%).
Australian economic events and implications
Reserve Bank of Australia board minutes for the August meeting contained a very detailed discussion about the two decisions presented to the Board: keep the cash rate steady or increase the cash rate by 0.25% from 4.35% to 4.6%. The main argument for a hike was that there are still too many upside inflation risks at a time when inflation has been above target over a long period. And perhaps it is better to mitigate these risks by tightening monetary policy pre-emptively. The case to leave rates on hold was because there had already been earlier increases to interest rates and that the economy was already moving towards more optimal levels of inflation and full employment (and home prices had declined more than expected and the unemployment rate was a little higher). But overall the Board seemed willing to raise rates if “upside [inflation] risks materialise”. The flow of data this week, particularly on inflation, suggests that these upside risks may already be playing out.
The July monthly inflation figures showed a 1% rise, or 3.5% over the year – down from 3.8% last month. The bigger issue was trimmed mean at 3.6% which was the same as last month and above expectations. Importantly, the trimmed mean measure is now running above the RBA’s forecast for the September quarter of 3.5%. This will be problematic for the Board who is so laser-focused on upside inflation risks.
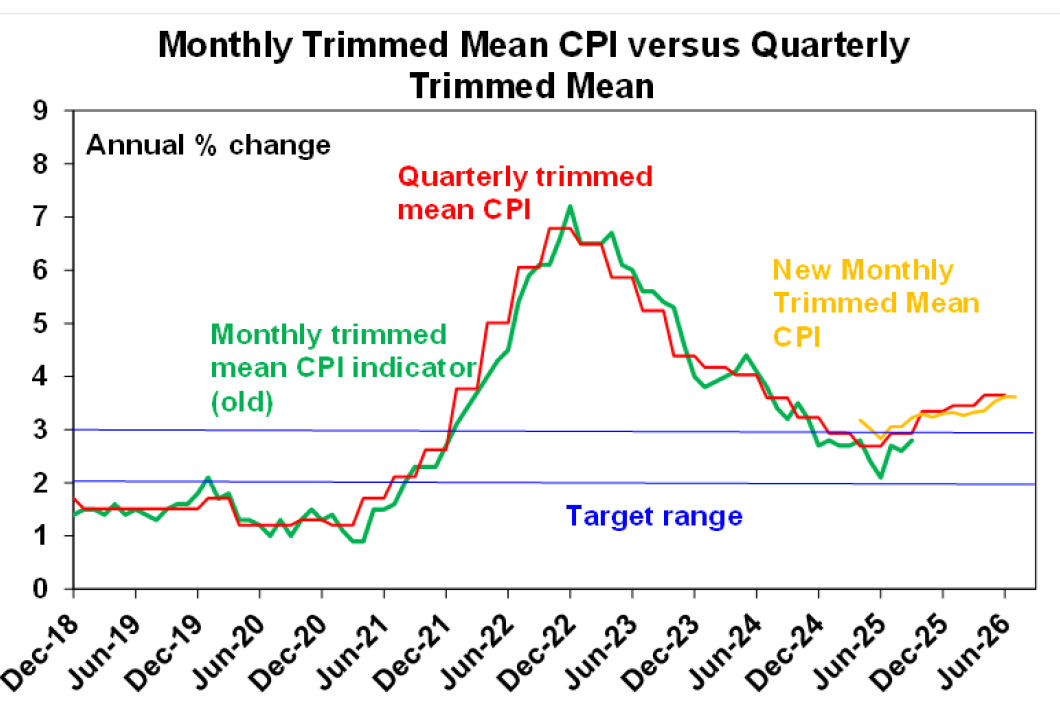
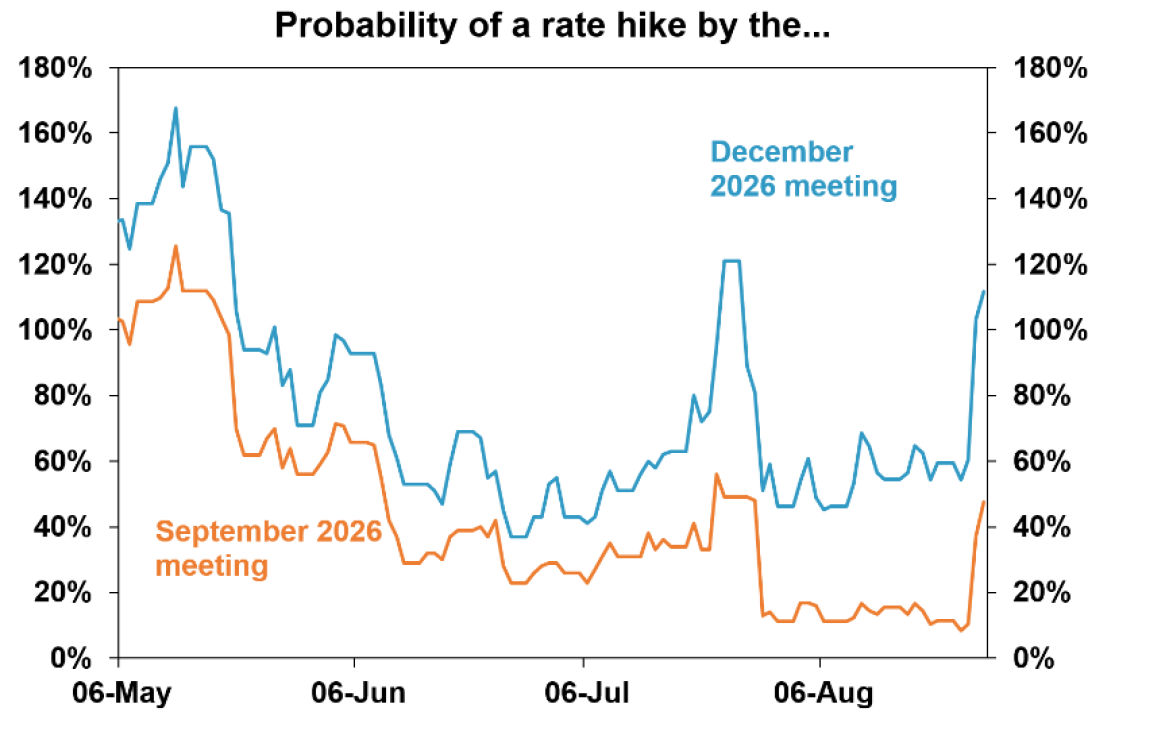
The next RBA Board meeting is in late September, but there is no other inflation data before then. As a result, some economists have shifted to expecting a September rate hike. We had been expecting a November increase and remain of that view for now because it is possible that the relatively new monthly CPI figures have overshot for July. But, a September rate hike which would take the cash rate from 4.35% to 4.6% is clearly risk. I would say there’s a 50% change of a hike in September.
Financial market pricing for the possibility of rate hikes bounces around faster than my kid on a trampoline but its also now assigning at 50% change to a September hike (a big rise from ~10% just a few weeks ago). And it now suggests >100% chance of a hike before the end of the year.
Other data this week was mixed. Construction project work fell by 2.1% in the June quarter with engineering down but building up (good news for residential construction). Capital expenditure also fell after a huge rise last quarter in data centre spending so its more like a normalisation in usual business investment, rather than underlying weakness in business investment. And buildings capital spending rose in the June quarter. Taken together, construction activity looks like it will add to June quarter GDP growth but there will be some weakness in engineering and plant and equipment.
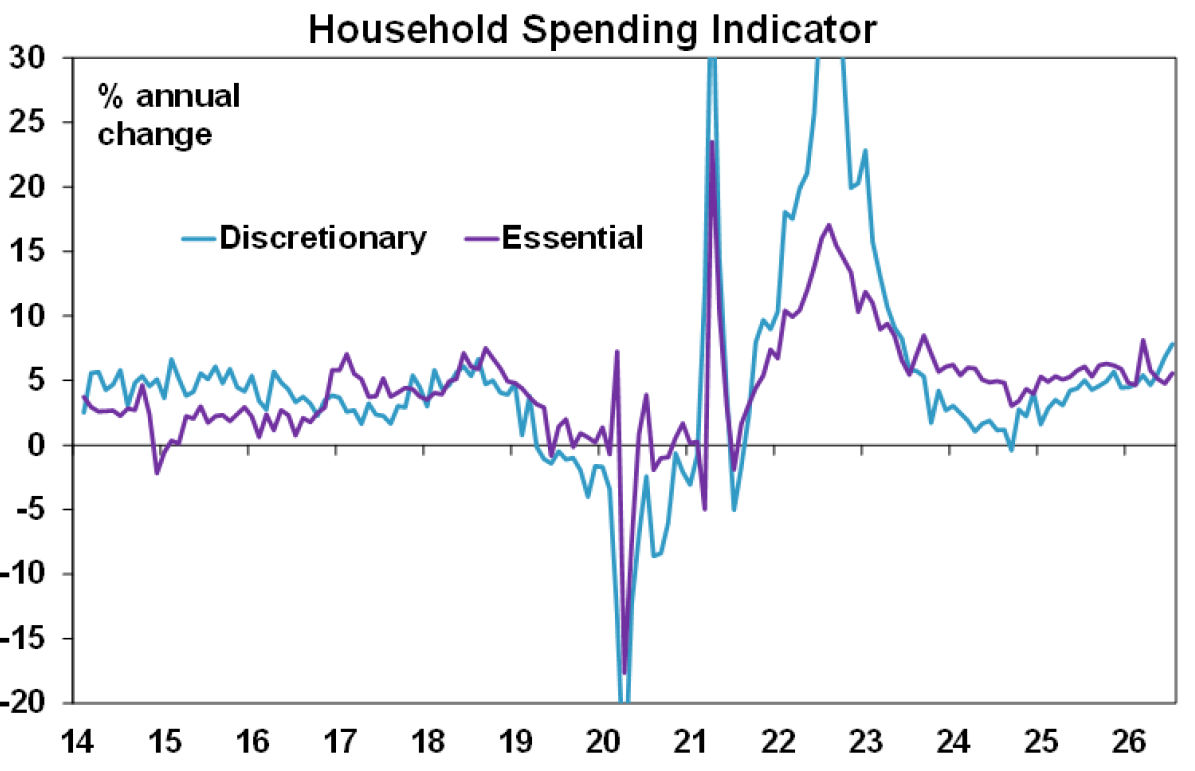
But consumer spending is still holding up with household spending up 1.1% in July, growing by 7% over the last year. Both discretionary and essential spending is up. July spending was driven by clothing and footwear, recreation and culture and other miscellaneous items. So, despite the challenges of elevated inflation which erodes consumer spending and higher interest rates, consumers are still spending.
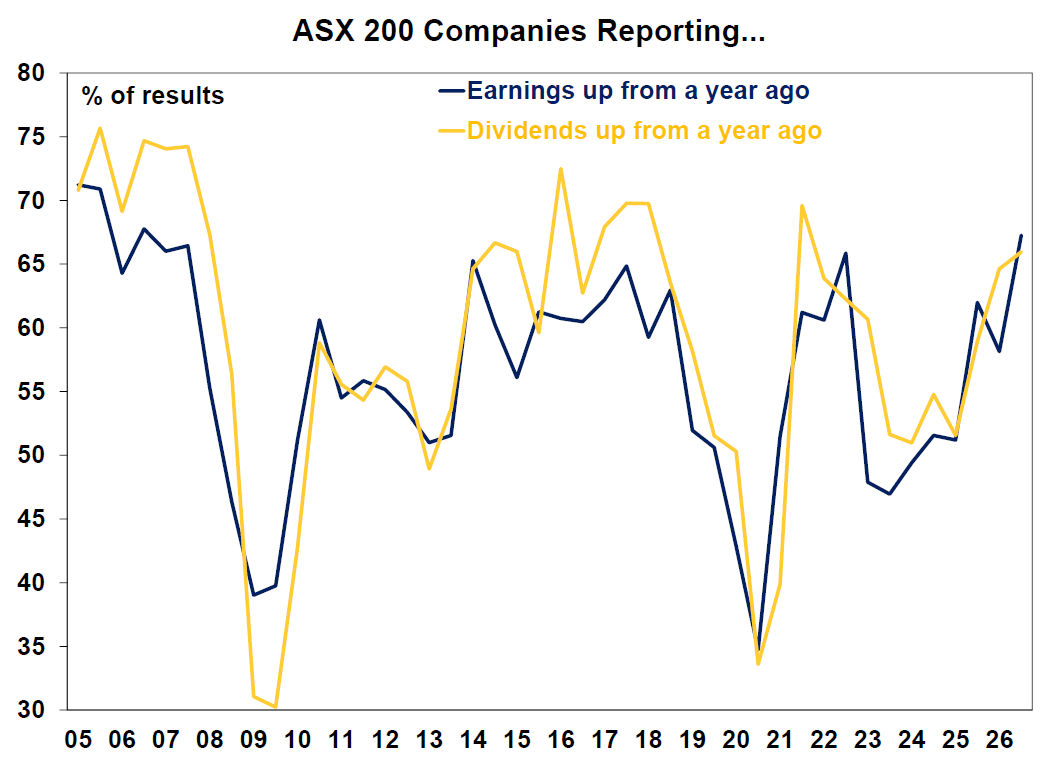
Australian reporting season is 90% complete. Profit growth has finally rebounded after three financial years of falls which is good news. The consensus estimate is for FY26 growth of 11.6% (which is ~0.5% lower than at the beginning of reporting season). The negative is that the improvement is narrowly based. Take out mining and energy and its more like 5.3%. FY27 earnings is around 10% – which is also solid. However, these numbers just pale in comparison to the blockbuster tech earnings from the US. There have been some encouraging results, like in healthcare (companies like CSL and Cochlear) as well as Super Retail Group, Universal Store, Mirvac and REA but these were all basically “less bad than feared” rather than signs of outright strength. Around 36% of earnings have been above expectations (lower than the usual 40%) with more results being “in line” with expectations.
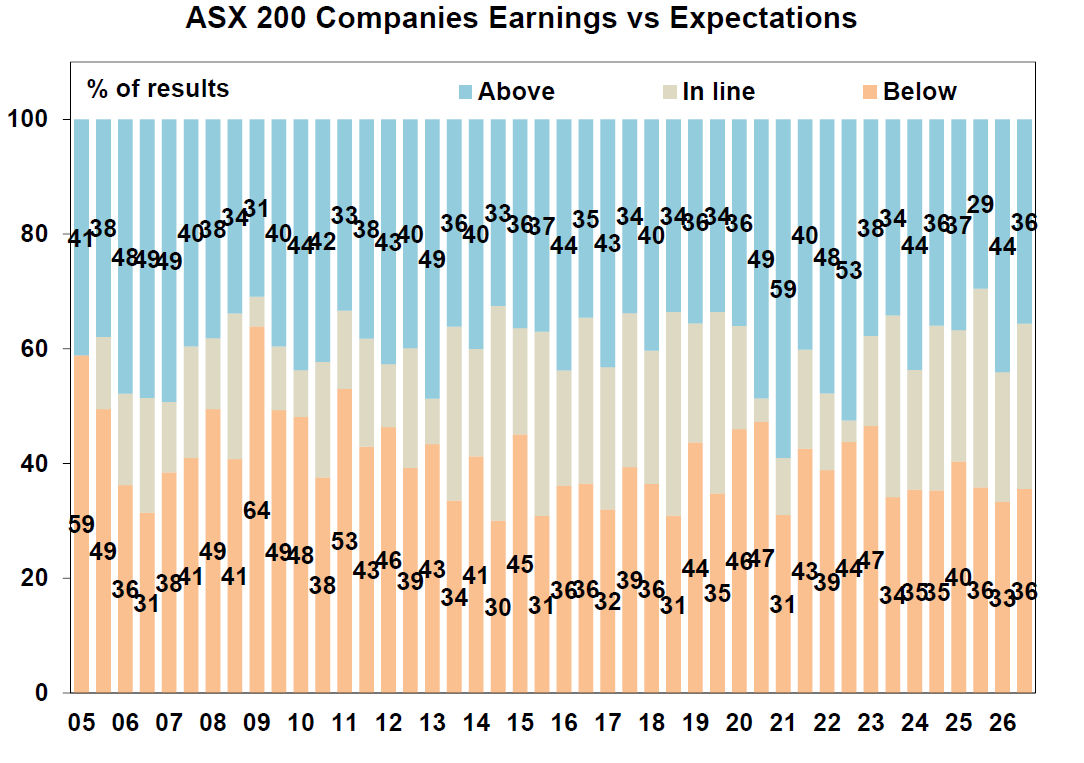
Dividend announcements have been positive with 59% announcing an increase in dividends from a year ago. And it’s good to see that 67% of earnings are up from a year ago. But the message is still that while profits are improving, the rebound is narrow and lacks the scale of what is occurring in countries like the US or Asia that have large tech exposures.
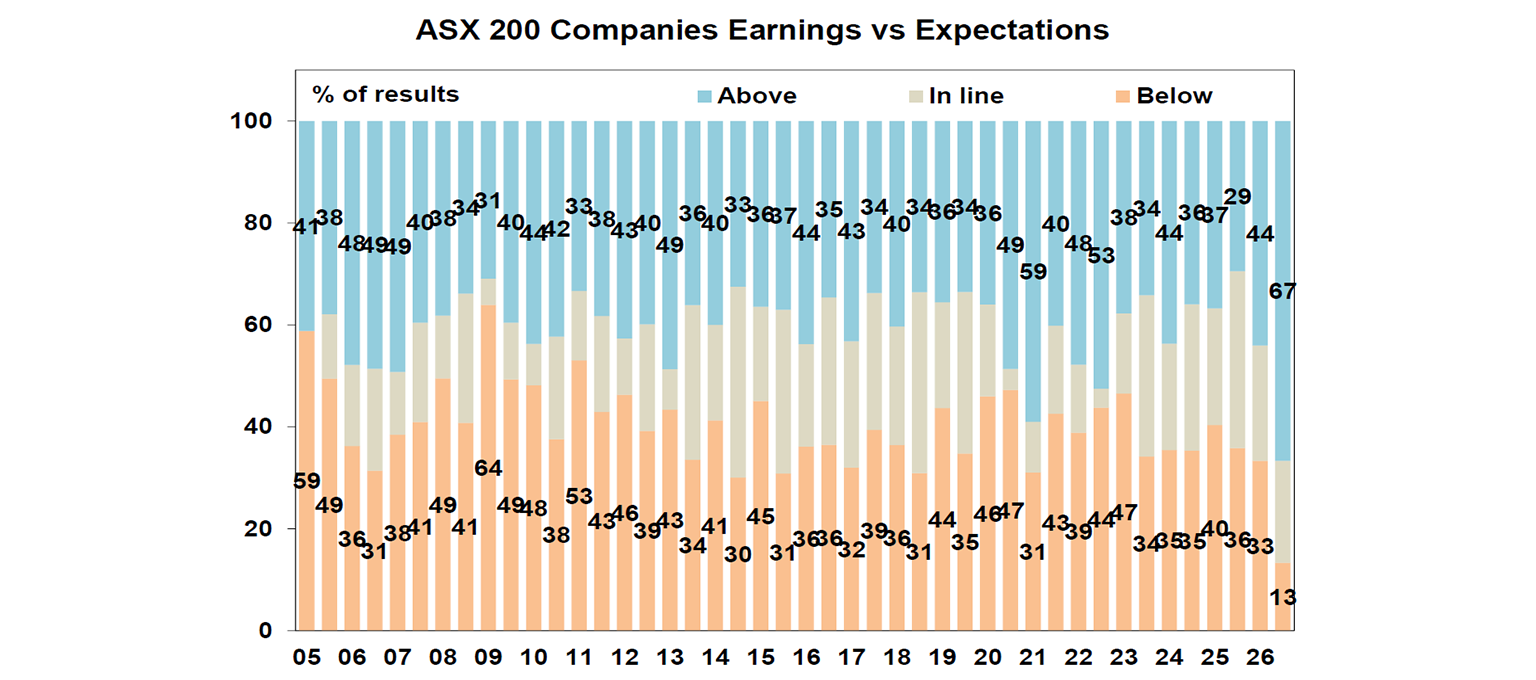
- So far, 67% of results surprised expectations on the upside while only 13% underwhelmed, much better than the historical average of around 40% each. But remember that it’s still early days!
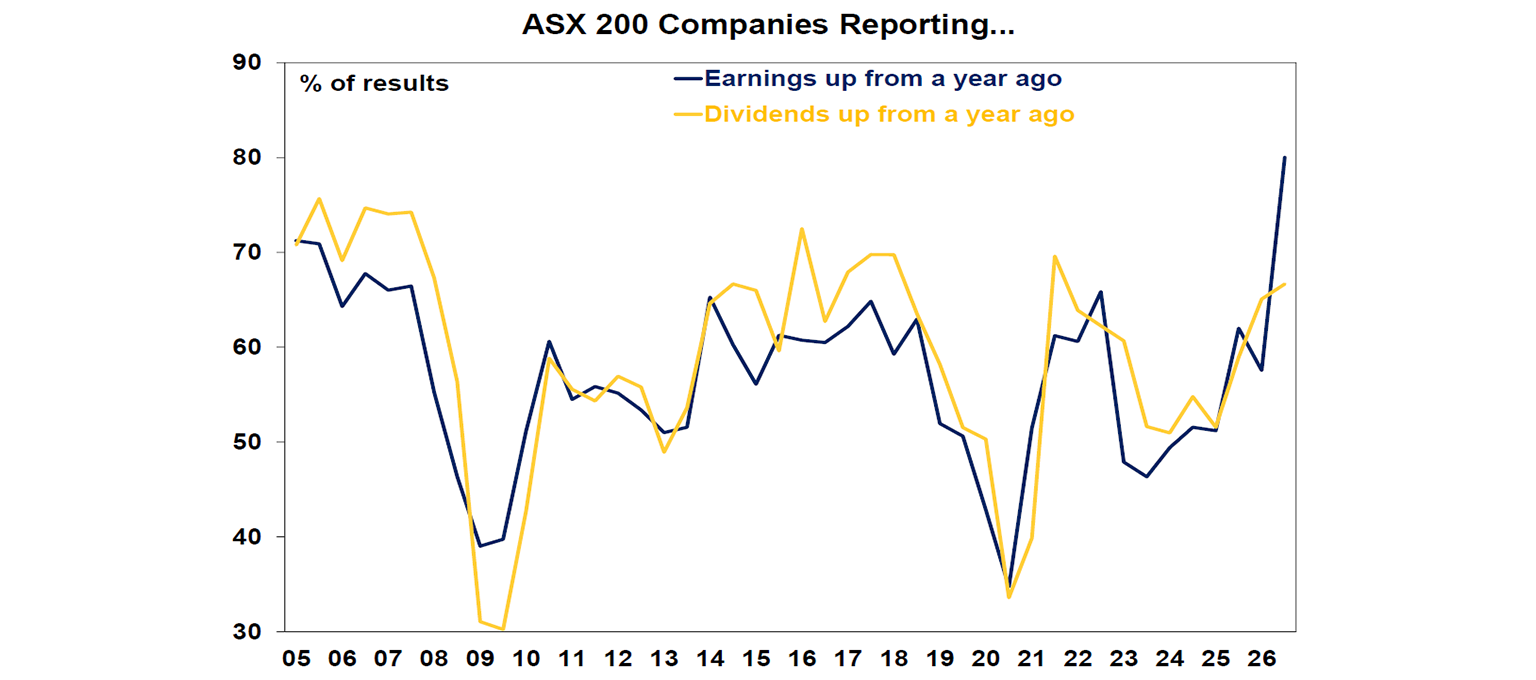
- 67% of companies have increased their dividends this earnings season, the highest since 2021, which is a good sign as it shows that companies have confidence in their cash flows to do so! But it’s lower than the percentage of reported companies which have seen historical earnings rise at 80%.
What to watch over the next week?
US economic data includes the August ISM manufacturing and services figures (expected to remain consistent with ongoing strength in activity), July job openings/quits data and the August payrolls to finish the week (should show moderate growth of ~55K, after a fall last month).
In Australia, the key is the June quarter gross domestic production (GDP) figures which show the pace of growth in the economy. We expected growth of 0.4% or 1.9% over the year which is close to the RBA’s forecast.
The monthly Cotality home price data indicates that the pace of price falls accelerated a little in August, with the daily data showing a monthly fall of 1% across the capital cities over the month with the largest decline in Sydney and Melbourne, but with falls also broadening out to Brisbane, Adelaide and Perth. We expect that price declines will continue due to the impacts of higher interest rates, the tax changes and general affordability pressures.
Other data of interest in Australia is July credit growth (softer in housing but stronger in business and other personal), a decline in building approvals in July after a large rise in the prior month) and the July trade balance (expected to be a $2.7bn surplus).
In other parts of the world watch for China PMI figures and the Bank of Canada decision (expected to be a hold).
Outlook for investment markets
Global and Australian share markets are likely to remain volatile with the lack of any long-term resolution to the Iran War and hit to global oil supplies, stretched valuations, sticky inflation, political uncertainty associated with Trump & the midterm elections and worries about the impact of AI and whether there is an AI bubble. However, returns should still be okay for the next 12 months as a whole thanks to continuing economic growth with recession avoided and strong global profit growth and likely rate cuts next year.
Bonds are likely to see returns around running yield or a bit less.
Unlisted commercial property returns are likely to be solid helped by strong demand for industrial property associated with data centres.
Australian home prices are expected to fall around 7% top to bottom, of which they have already done around 2%, out to the June quarter next year as a result of poor affordability, RBA rate hikes, reduced investor demand flowing from the winding back of negative gearing and the capital gains tax discount and poor confidence.
Cash and bank deposits are expected to provide returns around 4-5%.
The $A is likely to rise reflecting the wider interest rate differential to the US, although a move to Fed hikes may limit this. Fair value for the $A is around $US0.72.
Diana Mousina,
Deputy Chief Economist, AMP
Important information
Any advice and information is provided by AWM Services Pty Ltd ABN 15 139 353 496, AFSL No. 366121 (AWM Services) and is general in nature. It hasn’t taken your financial or personal circumstances into account. Taxation issues are complex. You should seek professional advice before deciding to act on any information in this article.
It’s important to consider your particular circumstances and read the relevant Product Disclosure Statement, Target Market Determination or Terms and Conditions, available from AMP at amp.com.au, or by calling 131 267, before deciding what’s right for you. The super coaching session is a super health check and is provided by AWM Services and is general advice only. It does not consider your personal circumstances.
You can read our Financial Services Guide online for information about our services, including the fees and other benefits that AMP companies and their representatives may receive in relation to products and services provided to you. You can also ask us for a hardcopy. All information on this website is subject to change without notice. AWM Services is part of the AMP group.